
The Changing Landscape of Research and Development Innovation, Drivers of Change, and Evolution of Clinical Trial Productivity
24 April 2019
The development of innovative medicines has evolved dramatically over the past decade. This study assesses the activity and landscape of research and development (R&D) in 2018, the productivity levels of the clinical development process and how key trial-trends will transform clinical development over the next five years. The features and development path of both newly launched therapies and pipeline therapies are examined along with shifts in the companies bringing these drugs to the market. This report puts forth a proprietary Clinical Development Productivity Index that reflects changes in trial complexity, success and duration over time. Eight key trends driving change in clinical development are explored and their expected quantitative impact on productivity through 2023 are discussed.
The research included in this report was undertaken independently by the IQVIA Institute for Human Data Science as a public service, without industry or government funding. None of the analytics in this report are derived from proprietary sponsor trial information but are instead based on proprietary IQVIA databases and/or third-party information.
Report Summary
In 2018, 59 new active substances (NAS) were approved and launched in the United States of which 27% are new therapies to treat cancer and its symptoms and 20% are for the treatment of infectious diseases. Translating a scientific breakthrough to the development of a therapeutic medicine remains a slow process, with the 2018 cohort of NASs taking a median of 13.6 years from the time of first patent filing to launch. The companies bringing these drugs to the market are changing, with the role of emerging biopharma (EBP) companies growing. EBP companies patented almost two-thirds of new drugs launched in 2018 and registered 47% of them, while large pharma companies patented only one-quarter.
The pipeline of therapies under development has been expanding. The number of molecules in late-stage development totaled 2,891 in 2018, growing 39% over the past five years with oncology medicines increasing by 63% and Next-Generation Biotherapeutics (NGB) including cell, gene and nucleotide therapies more than doubling over the past three years – though they still represent less than 10% of the late-stage pipeline.
Investment in future medical innovations continued to grow in 2018 reflecting confidence in scientific innovation to tackle unmet health needs. Venture capital firms invested over $23 billion in 2018, and the 15 largest pharmaceutical companies recorded more than $100 billion in R&D expenditure for the first time, up 32% over the past five years.
The total number of clinical trials that started in 2018 similarly indicate robust growth in R&D of 9% over the prior year and 35% over the past five years. The average progression time for a drug from beginning of Phase I trials to the end of development has increased by 26% over the past ten years and rose by six months in 2018 to 12.5 years. The composite success rate for clinical development stages from Phase I trials to regulatory submission – based on the percent of drugs successfully progressing to each next stage of development – fell to 11.4% in 2018. Across therapy areas composite success rates also varied, ranging between 6−15%, with rates for rare diseases and GI/NASH exceeding averages.
A Clinical Development Productivity Index was developed to measure trial success rates in relation to the effort invested in clinical trials. Applying this new metric across trials in nine of the largest therapy areas showed that productivity has fallen 27% overall from 2013 to 2018, heavily influenced by a decrease in Phase I trial productivity of 55%, as well as declines in Phase III since 2016. In Phase I, declines reflect diminishing success of 7% and 6% increases in trial complexity (which includes numbers of trial participants, eligibility criteria, research sites countries, and endpoints).
Eight key trends in technology, science and data use are currently influencing clinical development. Their impact on trial design, complexity, duration and success was explored through the IQVIA Clinical Development Trends Impact Assessment completed by IQVIA therapy area experts. On average across therapy areas, all trends were considered to have a high likelihood of impact, ranging between 74–85% and were expected to reach their peak impact within 2.5–4.0 years. Many of the therapy areas with the most complex trials will see impacts of these trends within three years. GI/NASH, neurology and cardiovascular trials were also deemed most likely to see those changes rapidly, with changes resulting from nearly all trends.
The Clinical Development Trends Impact Assessment was also used to model the future expected impact of each key market trend on clinical development productivity across trial phases and the nine key therapeutic areas. Results show that each trend will have a differential impact on trial productivity, success and effort across therapy areas in the next five years. For example, biomarkers will have the greatest impact on clinical productivity yielding a 34% average increase across therapy areas. Similarly, pools of pre-screened patients will yield a high increase in productivity of 29% on average by driving the largest average declines in effort, at -11%. Trends impacting productivity varied by therapy area. For example, in oncology, pools of pre-screened patients will accelerate trial recruitment and biomarkers will improve success rates, leading to productivity improvements as high as 104% and 71%, respectively.
Key Findings
Of the NASs launched in 2018, 46% were approved based on data from trials with fewer than 500 total subjects
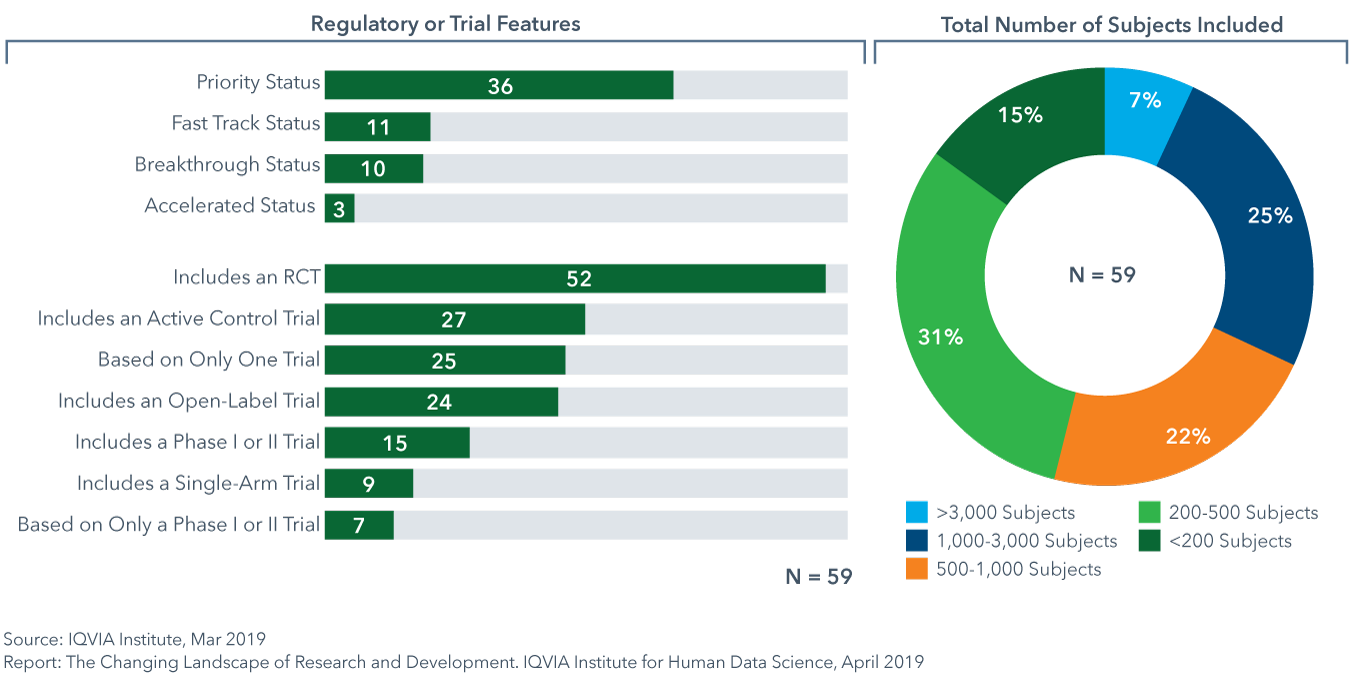
- 59 new active substances (NAS) were launched in 2018; higher than in any of the past 5 years.
- 12 of the NASs were medicines that stratify patient selection based on predictive biomarkers, 4 were approved with a companion diagnostic and 16 were oncology medicines.
- Approval based on active control trials has increased by approximately 20% since 2016, for 46% of NAS in 2018, suggesting a greater number of diseases with gold standard treatment and growing interest by payers to see comparative effectiveness data.
- While 32% of NASs launched in 2018 were based on data from more than 1,000 subjects, 46% enrolled under 500 subjects in trials as cited in FDA approval announcements.
Emerging biopharma companies now account for over 70% of the total late stage R&D pipeline
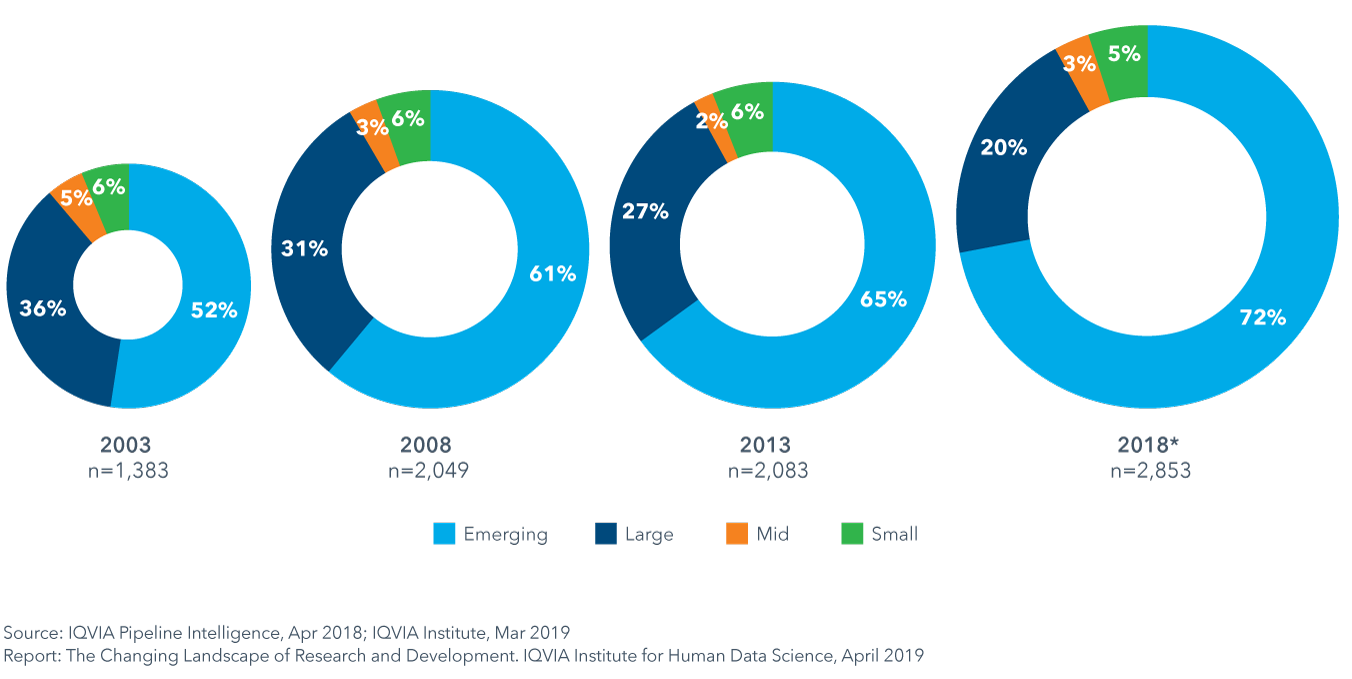
- The expanding role of emerging biopharma (EBP) companies in developing innovative medicines is being driven by their activity in rapidly growing areas of oncology and orphan drugs, and their diminished need for partnership or acquisition to develop their innovative medicines.
- Since 2013, the absolute number of active R&D compounds has increased 37%, and this will likely support a continued increase in the number of EBP-launched drugs over the next five years.
- EBP companies were the originator of 64% of the 59 NASs launched in 2018.
- Although the majority of the assets of EBPs used to be sold or licensed before the launch of a novel product, 47% of 2018 NASs were launched by EBP companies in the United States in 2018.
Composite success rates varied by therapy area between 6−15% in 2018, with rates for rare diseases and GI/NASH exceeding averages
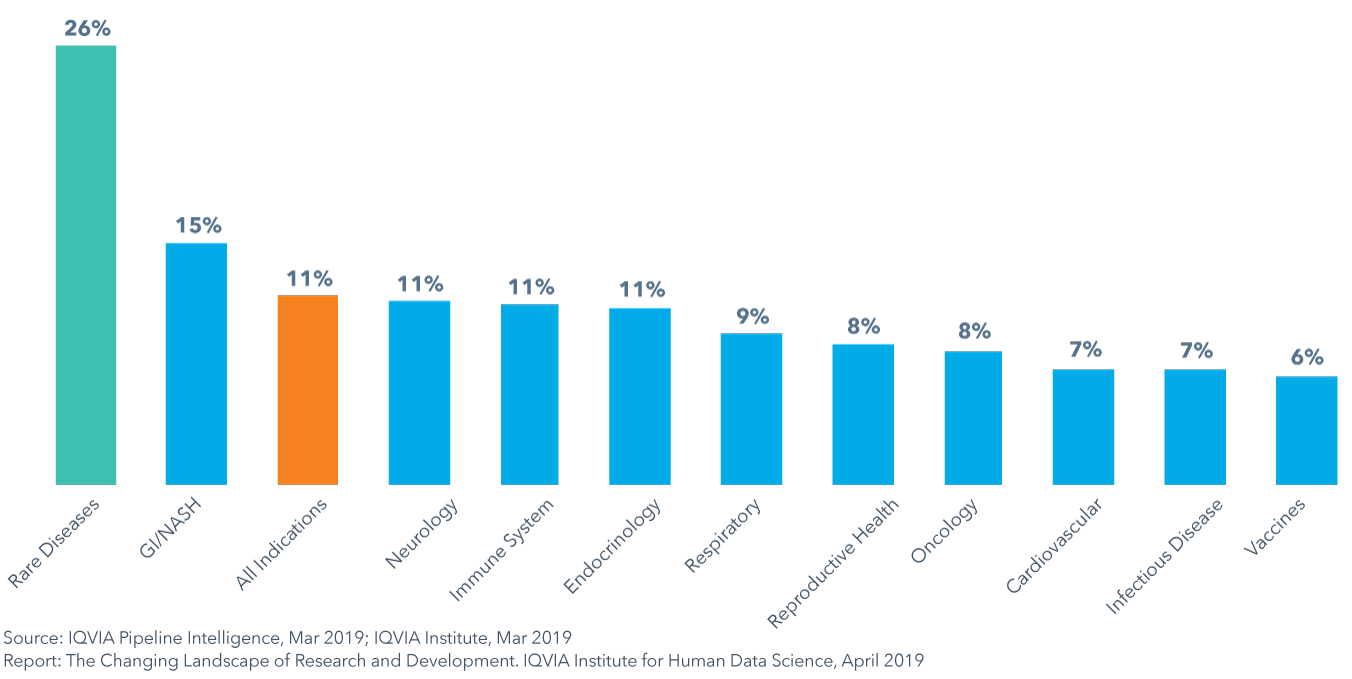
- The composite success rate of clinical development from Phase I to regulatory submission fell to 11.4% in 2018, down from 14.4% in 2017 and below the average of 14% in the prior ten years.
- GI/NASH is the only therapy area to have composite success rates above the average while vaccines in infectious disease had the lowest composite success rate at 6%, in part due to high development costs and challenges with patient recruitment and retention.
- To examine the productivity of the clinical development process, a Clinical Development Productivity Index is useful to measure trial success in relation to the effort invested in trials.
- Trial productivity has been highest for respiratory, infectious disease and endocrinology and lowest for oncology and declined 27% from 2013 to 2018 across all trial phases, heavily influenced by a decrease in productivity in Phase I.
Eight key trends are influencing aspects of trial design, duration and success
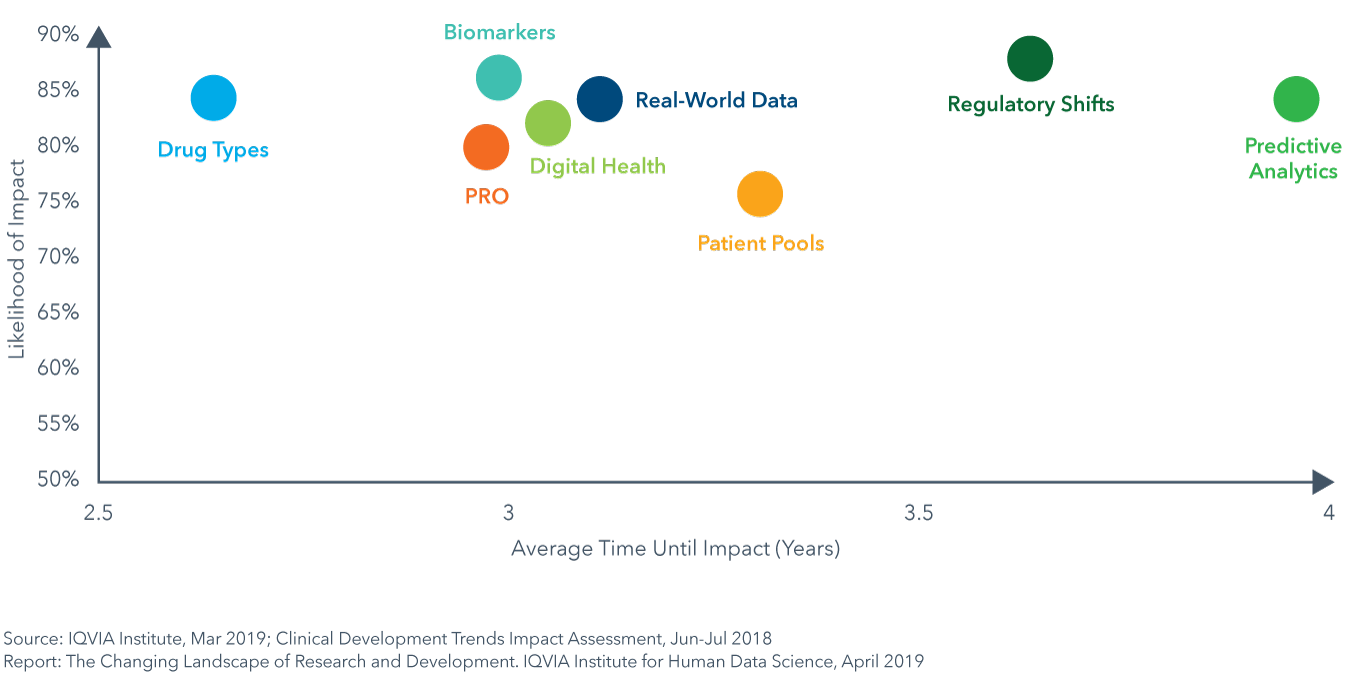
- Application of Digital Health / Mobile Technologies will enable the capture of drug efficacy and safety data remotely and improve patient safety, enable virtual trial formats and ease site work burden (see page 35).
- An increased focus on patient-reported outcomes (PRO) will shed new light on patient experience and drug efficacy and safety outside the clinical setting, and lead to accelerated trial times as endpoints shift (see page 37).
- Real-world data (RWD) will be used to optimize trial design, speed trials by aiding in investigator and site selection, and will enable new trial designs by acting as virtual control arms and supporting pragmatic, adaptive and RWE registry trial designs (see page 39).
- Predictive analytics and artificial intelligence (AI) will mine data to identify new clinical hypotheses to test, reduce trial design risks and speed enrollment by identifying protocol-ready patients or predicting which patients have disease and may be eligible (see page 41).
- Shifts in types of drugs (Next-Generation Biotherapeutics and targeted therapies) will improve efficacy and success rates and have accelerated development timelines but will require longer-term patient follow up (see page 44).
- The increased availability and ease of biomarker testing will help narrow patient populations to those more likely to see effect, resulting in improvements in efficacy, safety and success (see page 47).
- Changes in the regulatory landscape will further the adoption of precision medicine approaches, novel trial designs and endpoints and provide means for accelerated drug approvals and regulatory success (see page 49).
- Availability of pools of pre-screened patients and direct-to-patient recruitment will facilitate trial recruitment and hitting accrual targets, decrease trial duration and lead to accelerated market availability (see page 51).
Biomarkers will have the greatest impact on clinical productivity yielding a 34% average increase across all phases of development
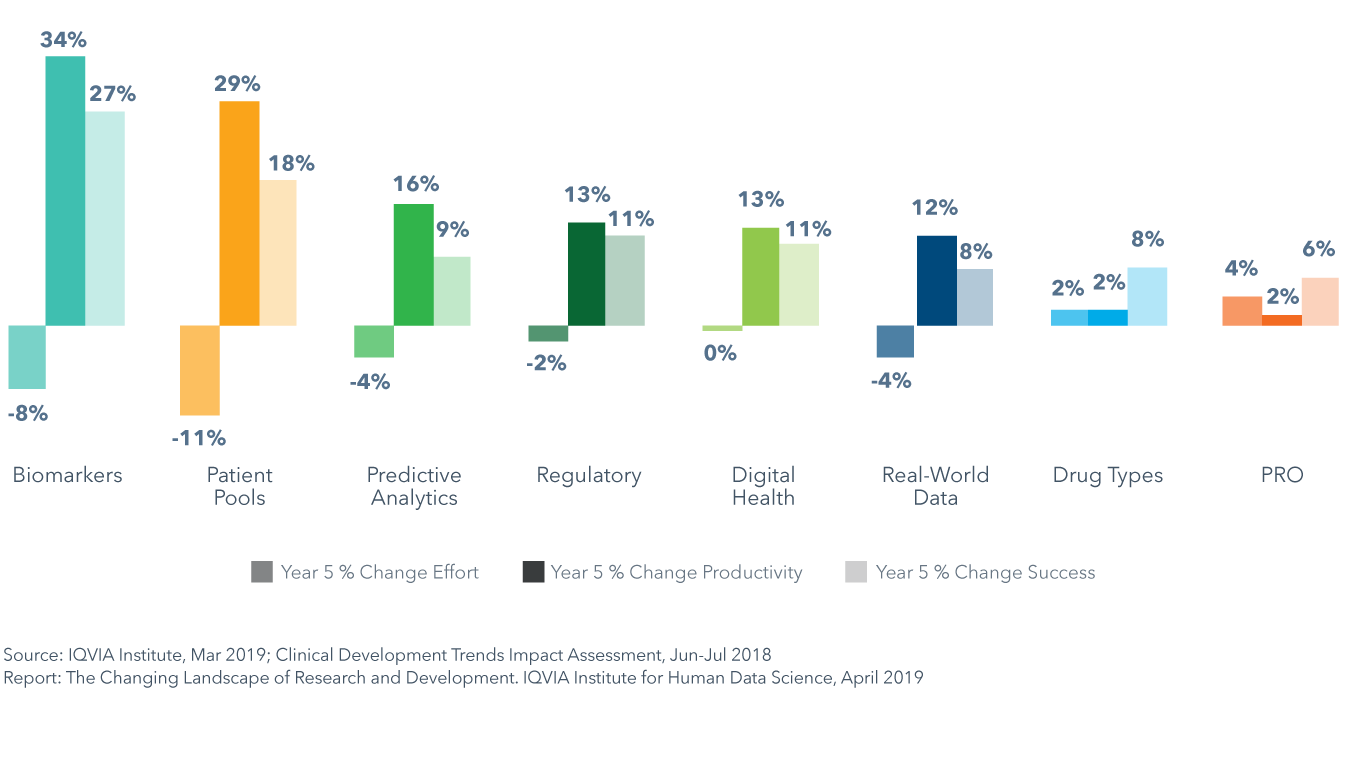
- Results of the Clinical Development Trends Impact Assessment show that each of the eight trends will have a differential impact on trial productivity, success and effort across therapy areas in the next five years.
- Biomarkers will have the greatest impact on clinical productivity and pools of pre-screened patients will yield a similarly high increase in productivity of 29% on average by driving the largest average declines in effort of -11%.
- Shifts in drug types and the incorporation of patient-reported outcomes (PRO) into trials are expected to increase trial effort by 2% and 4%, respectively, on average across all phases and therapy areas, and will each decrease productivity in 4–5 therapy areas.
- Pools of pre-screened patients will accelerate trial recruitment in oncology and lead to productivity improvement as high as 104%, while biomarkers will improve success rates in oncology by 71%, and yield consistently high improvements of over 45% across four other therapy areas: GI/NASH, rare disease, neurology and cardiovascular.